GPU Autoscaling is Broken: What I Learned Scaling LLM Inference to 10K QPS
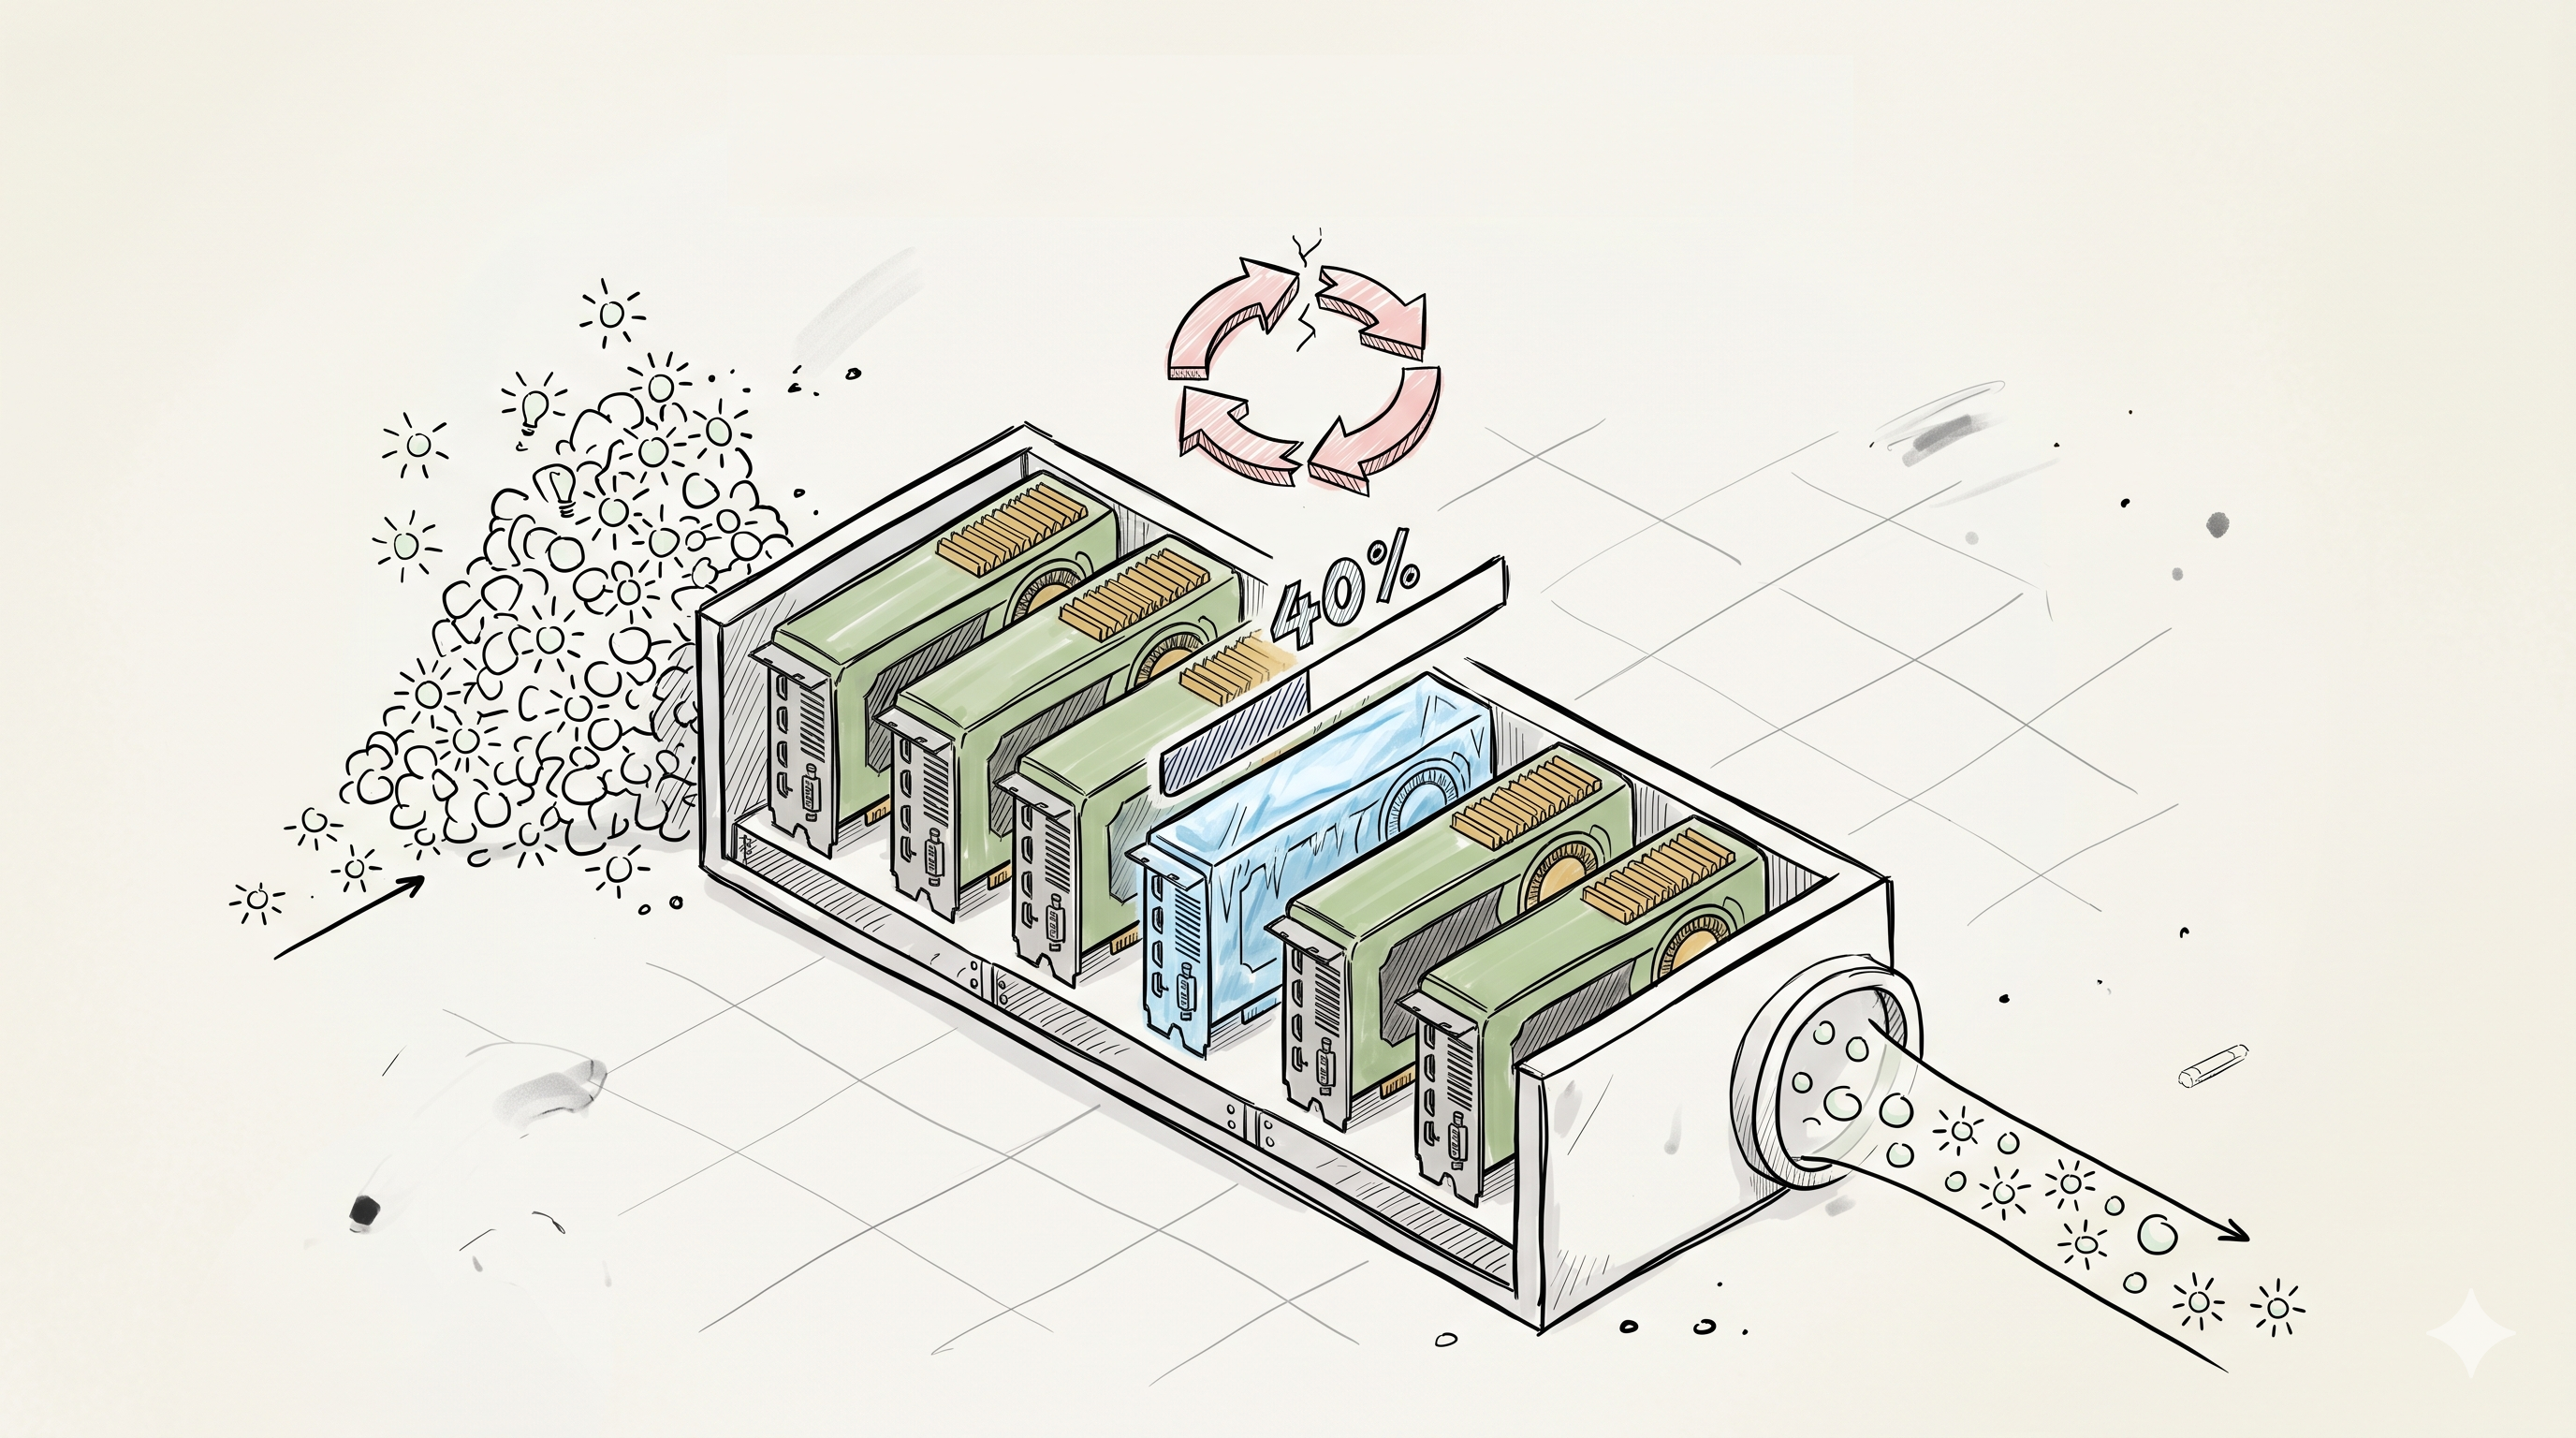
Standard Kubernetes autoscaling assumes more load = more pods = more capacity. With stateless REST APIs, that works. With LLM inference, it falls apart — and it took us three months of production pain at 10K QPS to figure out why.
This post covers the four patterns that actually worked, the exact configs we run, and the numbers before and after: p99 latency from 12s down to 1.8s, OOM kills from 3% to under 0.1%, GPU utilization from 40% to 75%.
Two companions go alongside this one: engine selection and quantization (which engine and precision to run before you scale anything) and the GPU memory capacity-planning guide (how much GPU to buy in the first place).
Why HPA Assumptions Break on GPUs
Four assumptions baked into the Horizontal Pod Autoscaler are simply false for LLM serving:
Cold start is brutal. Loading Llama 3.1 70B — pulling ~140GB of weights, sharding across GPUs, compiling CUDA graphs, warming the KV cache allocator — takes 2–5 minutes. HPA reacts to load in ~30 seconds. By the time new pods are actually serving, your queue is already a disaster.
Memory isn't fungible. A normal API packs hundreds of pods per node. LLM serving is memory-bound: model weights plus KV cache eat the whole GPU. A 70B model in FP8 needs 2 H100s minimum; with tensor parallelism of 4 for decent throughput, an 8×H100 node holds exactly 2 replicas. Your scaling granularity is half a node, not a pod.
Latency is bimodal. The first message in a conversation prefills 200 tokens and returns fast. The 50th message drags 8K tokens of context through prefill every turn. Average latency tells you nothing — you need to watch time-to-first-token and queue depth separately.
Preemption is catastrophic. Kill a stateless pod mid-request and the client retries against another replica. Kill a vLLM pod mid-generation and the user watches their answer stop mid-sentence. Not a 503 — a truncated response. Retrying means re-running the whole prefill somewhere else.
The Setup
The numbers in this post come from a self-hosted cluster:
- Model: Llama 3.1 70B Instruct, FP8 quantized
- Engine: vLLM 0.21 (v1 engine, async scheduler on by default)
- Hardware: 8×H100 SXM nodes, tensor parallelism 4 → 2 replicas per node
- Traffic: 10K QPS at peak across the platform, prompt lengths from 200 tokens to 8K context
- Orchestration: Kubernetes 1.33, KEDA 2.20, LiteLLM 1.88 as gateway, Argo Rollouts 1.9
Why self-host instead of calling an API? Two reasons. Data residency — our prompts contain customer data that can't leave the region, full stop. And cost at scale — past a few billion tokens a month, the math flips hard in favor of your own GPUs (numbers in section 5).
What Standard HPA Got Wrong
We started naive: CPU-based HPA. That lasted a day. vLLM pods sit at ~5% CPU while GPUs scream at 95% — HPA looked at our most loaded moment and concluded we should scale down.
So we switched to a custom metric, DCGM GPU utilization. Better, still wrong. Here's a real incident timeline from our traffic spike on a Monday morning:
09:00:00  Traffic ramps 2x. GPU util 92%, queue depth climbing.
09:00:30  HPA fires: desired replicas 8 → 14.
09:01:10  6 new pods scheduled. Status: Running. Readiness: passing (!)
09:01:10  HPA sees 14 "ready" replicas. Stands down.
09:01-09:04  The 6 new pods are still loading 140GB of weights.
             Actual serving capacity: still 8 replicas.
09:03:00  Queue depth 4,000+. p99 latency 12s. Users churning.
09:04:30  New pods finally serve. Queue drains. Too late.
We call the gap at 09:01–09:04 the ghost capacity problem: pods that count as ready but contribute zero capacity. Our readiness probe hit vLLM's /health endpoint, which returns 200 as soon as the HTTP server is up — minutes before the model can serve a token.
The fix for the probe is easy — use /health only for liveness and gate readiness on an actual inference:
readinessProbe:
  exec:
    command:
      - python
      - -c
      - |
        import requests, sys
        r = requests.post("http://localhost:8000/v1/completions",
            json={"model": "llama-3.1-70b", "prompt": "ping", "max_tokens": 1},
            timeout=5)
        sys.exit(0 if r.status_code == 200 else 1)
  initialDelaySeconds: 60
  periodSeconds: 10
  failureThreshold: 30
But even with honest readiness, GPU utilization is the wrong signal. A GPU at 90% with an empty queue is healthy. A GPU at 90% with 500 queued requests is drowning. The metric can't tell them apart. Queue depth can — which leads to the patterns that worked.
The 4 Patterns That Actually Worked
Pattern A: Pre-Warmed Pool with Predictive Scaling
You cannot react your way out of a 3-minute cold start. You have to scale before the load arrives, not after.
Our traffic is human-driven, so it's predictable: weekday ramp from 08:00, peak 10:00–16:00, trough overnight. KEDA's cron scaler encodes that directly, and we combine it with a queue-depth trigger as the reactive backstop:
apiVersion: keda.sh/v1alpha1
kind: ScaledObject
metadata:
  name: vllm-llama70b
spec:
  scaleTargetRef:
    name: vllm-llama70b
  minReplicaCount: 4
  maxReplicaCount: 24
  cooldownPeriod: 600          # scale down slowly — cold starts are expensive
  triggers:
    # Predictive floor: business hours need at least 16 replicas
    - type: cron
      metadata:
        timezone: Asia/Bangkok
        start: 0 7 * * 1-5     # 1h before the morning ramp
        end: 0 19 * * 1-5
        desiredReplicas: "16"
    # Reactive backstop: queued requests per replica
    - type: prometheus
      metadata:
        serverAddress: http://prometheus.monitoring:9090
        query: sum(vllm:num_requests_waiting) / count(up{job="vllm"})
        threshold: "20"
Two details matter here. The cron window starts one hour before the ramp — that's cold-start time plus margin. And cooldownPeriod is 10 minutes, because flapping is far more expensive than holding a replica: every scale-down you regret costs you a 3-minute cold start on the way back up.
We also feed a leading indicator: the frontend reports active sessions to Prometheus, and a recording rule projects expected QPS 10 minutes out. Sessions convert to inference requests at a stable ratio, so rising DAU tells us to scale before the queue ever moves.
Pattern B: Queue at the Edge, Not the Pod
vLLM has an internal queue, and your first instinct is to let it absorb bursts. Don't. A deep queue inside the pod converts overload into OOM kills and multi-minute latencies. A queue at the edge converts overload into fast, honest 429s.
We cap concurrency per replica at the gateway and shed load early. With LiteLLM as the gateway:
# litellm config.yaml
model_list:
  - model_name: llama-3.1-70b
    litellm_params:
      model: hosted_vllm/llama-3.1-70b
      api_base: http://vllm-llama70b.inference:8000/v1
router_settings:
  routing_strategy: least-busy
  timeout: 120
litellm_settings:
  max_parallel_requests: 64        # per replica — matches vLLM --max-num-seqs
  queue_timeout: 10                # wait max 10s, then 429
And we pin vLLM so it can't overcommit:
vllm serve meta-llama/Llama-3.1-70B-Instruct \
  --tensor-parallel-size 4 \
  --quantization fp8 \
  --max-num-seqs 64 \
  --max-model-len 16384 \
  --gpu-memory-utilization 0.92
The client treats 429 as "retry with backoff or fail over." That's recoverable. A response that dies at token 300 of 500 is not. Reject early, never mid-generation.
Pattern C: KV-Cache-Aware Routing
vLLM's prefix caching reuses KV cache for shared prompt prefixes — system prompts, few-shot examples, conversation history. But it's per-replica. Round-robin a 50-message conversation across 16 replicas and every replica re-prefills the context from scratch.
We route sticky: hash the conversation ID so every turn of a session lands on the same replica. The crude version is one line of Envoy/nginx config (hash $http_x_session_id consistent); the better version, which we run now, is the Gateway API Inference Extension — an endpoint picker that tracks each replica's prefix-cache state and queue depth and routes to the replica that already holds your prefix.
The impact was the single biggest win in this whole post:
| Metric | Round-robin | Prefix-aware routing |
|---|---|---|
| Prefix cache hit rate | ~30% | ~80% |
| p50 time-to-first-token (8K context) | 3.2s | 0.4s |
| Effective capacity per replica | baseline | ~1.6× |
Prefill is the expensive half of inference. Skipping 80% of it is equivalent to buying more GPUs — except it's free.
Pattern D: Disruption Budgets Over Aggressive Scaling
A pod evicted mid-generation truncates every in-flight response. Node drains, cluster-autoscaler bin-packing, spot reclaims, rollouts — all of them will happily kill a generating pod unless you stop them.
Three layers of protection:
apiVersion: policy/v1
kind: PodDisruptionBudget
metadata:
  name: vllm-llama70b
spec:
  minAvailable: 80%
  selector:
    matchLabels:
      app: vllm-llama70b
# In the pod spec: drain before dying
terminationGracePeriodSeconds: 300
lifecycle:
  preStop:
    exec:
      command: ["/bin/sh", "-c",
        "curl -X POST localhost:8000/drain; \
         while [ $(curl -s localhost:8000/metrics | grep -c 'num_requests_running [^0]') -gt 0 ]; \
         do sleep 5; done"]
# Keep cluster-autoscaler's hands off
annotations:
  cluster-autoscaler.kubernetes.io/safe-to-evict: "false"
The preStop hook tells the gateway to stop sending new requests, then waits for in-flight generations to finish — up to 5 minutes. Scale-down becomes a drain, not an execution. Since adding this, truncated responses from voluntary disruptions went to zero.
The Actual Numbers
| Metric | Before (HPA on GPU util) | After (patterns A–D) |
|---|---|---|
| p99 end-to-end latency | 12s | 1.8s |
| Requests lost to OOM kills | 3% | <0.1% |
| GPU utilization (busy hours) | 40% | 75% |
| Prefix cache hit rate | 30% | 80% |
| Truncated responses (voluntary disruption) | daily | zero |
The utilization number deserves a note: 40% before wasn't "lots of headroom," it was waste caused by panic over-provisioning — we kept replicas pinned high because we didn't trust scaling. Predictive scaling let us trust the floor and run hot.
Cost per million tokens, with the arithmetic shown so you can plug in your own rates: an 8×H100 node at ~$3/GPU-hr reserved is $24/hr and runs 2 replicas. Each replica sustains ~3,000 output tokens/sec under continuous batching, so the node produces ~21.6M tokens/hr at full load. At 75% utilization that's ~$1.50 per million output tokens, all-in.
Compare: at our peak month (~40B tokens), a frontier API at $10/M output tokens would bill ~$400K; a hosted Llama 3.1 70B endpoint at ~$0.90/M would bill ~$36K. Our cluster cost ~$60K/month. Self-hosting a 70B doesn't beat commodity hosted endpoints on price alone — data residency is what made it mandatory for us. It crushes frontier-API pricing, though, if a 70B is good enough for your workload. Run this math honestly before you build any of the above.
The Tooling Stack
| Tool | Version | Role |
|---|---|---|
| vLLM | 0.21 | Inference engine |
| KEDA | 2.20 | Cron + queue-depth scaling |
| LiteLLM | 1.88 | Gateway, edge queueing, failover |
| Gateway API Inference Extension | v1.x | KV-cache-aware routing |
| Prometheus + DCGM exporter | — | Metrics |
| Argo Rollouts | 1.9 | Canary model updates |
Why vLLM over TGI: continuous batching and paged KV cache landed first in vLLM and the gap never closed for our workload — we measured ~1.8× throughput on identical hardware at the time we chose. The ecosystem followed: prefix caching, FP8, speculative decoding, and the production-stack tooling all ship in vLLM first, and Hugging Face has since refocused TGI toward backend flexibility rather than raw serving performance.
The four custom metrics that matter (vLLM exports them natively at /metrics):
-
vllm:num_requests_waiting— the scaling signal. This is your queue depth. -
vllm:gpu_cache_usage_perc— KV cache pressure. Above 90%, preemption inside vLLM begins. -
vllm:time_to_first_token_seconds— what users feel. Alert on p95. -
vllm:generation_tokens_total(rate) — real throughput, for capacity planning and the cost math above.
Canary model updates with Argo Rollouts: model weights are part of the artifact, so a "small" model update is a full redeploy of a 140GB payload. We canary 1 replica, mirror 5% of traffic, and compare token throughput and refusal rates for an hour before promoting. With maxSurge: 1 — you do not have spare H100s for a classic blue-green.
What I'd Do Differently
Spot instances for batch — yes, with caveats. Offline workloads (evals, embeddings backfill, summarization queues) moved to spot H100s at ~60% discount. The caveat: checkpoint at the request level and make every job idempotent, because reclaims interrupt generation no matter what your PDB says. PDBs don't apply to spot reclaims — only the 2-minute warning does, and a 70B can't even reload in that window. Never put interactive traffic on spot.
Multi-model serving on shared hardware — harder than it looks. We tried packing Mixtral 8×22B and Llama 3.1 70B on the same nodes to smooth utilization. The problem is KV cache contention: two engines each claiming gpu-memory-utilization 0.45 halves the batch capacity of both, and the latency interference between their schedulers is ugly. What worked instead: time-slicing at the node-pool level (repurpose whole nodes per model on a schedule), not GPU sharing. MIG doesn't help — a 70B needs whole GPUs.
For the 400B+ class, we stopped autoscaling entirely. A Llama 3.1 405B replica spans an entire 8×H100 node and cold-starts in ~15 minutes. Autoscaling at that granularity is fiction — your minimum scaling step is a node and your reaction time is a coffee break. We run a fixed pool sized for peak plus one replica of headroom, and we route overflow to the 70B tier instead. Over-provisioning is a strategy, not a failure, when the scaling unit is that coarse.
The Takeaway for Cloud Engineers
Treat LLM serving like a stateful workload, not a stateless API. Pods hold gigabytes of warm KV cache, requests are long-lived and unresumable, and replicas are not interchangeable mid-conversation. Every pattern in this post follows from that one reframe.
Your bottleneck isn't compute — it's memory and the cache. The H100s were never the constraint. KV cache capacity, prefix cache hit rate, and weight-loading time decided everything. If you're staring at GPU utilization graphs, you're looking at the wrong dashboard.
"Scale fast" is the wrong instinct. "Scale predictively and protect in-flight work" is the right one. Reactive speed cannot beat a 3-minute cold start. Predict the load, hold the floor, queue at the edge, and never let Kubernetes kill a pod mid-sentence.
Summary
The checklist I'd hand to a platform team starting this today:
- Gate readiness on a real inference call, not vLLM's
/health— kill ghost capacity - Scale on
vllm:num_requests_waitingper replica, never on CPU or GPU utilization - Add a KEDA cron trigger that raises the floor 1 hour before your daily ramp
- Set
cooldownPeriod≥ 600s — flapping costs a cold start every time - Cap concurrency at the gateway (
max_parallel_requests= vLLM--max-num-seqs) and return 429s early - Route conversations sticky by session ID, or deploy the Gateway API Inference Extension for prefix-aware routing
- Add a PDB with
minAvailable: 80%and a preStop drain hook withterminationGracePeriodSeconds: 300 - Annotate pods
safe-to-evict: "false"so cluster-autoscaler can't bin-pack them away - Spot for batch only, with request-level checkpointing — never for interactive traffic
- For 400B+ models: skip autoscaling, fix the pool at peak + 1, route overflow to a smaller tier
- Do the cost math (
node $/hr ÷ tokens/hr) before building any of this — hosted 70B endpoints may already be cheaper unless data residency forces your hand
Discussion
Have thoughts on this post? Share them below — questions, corrections, or your own experience are all welcome.