A Minimal Open-Source AI Platform: Laptop First, Kubernetes Later
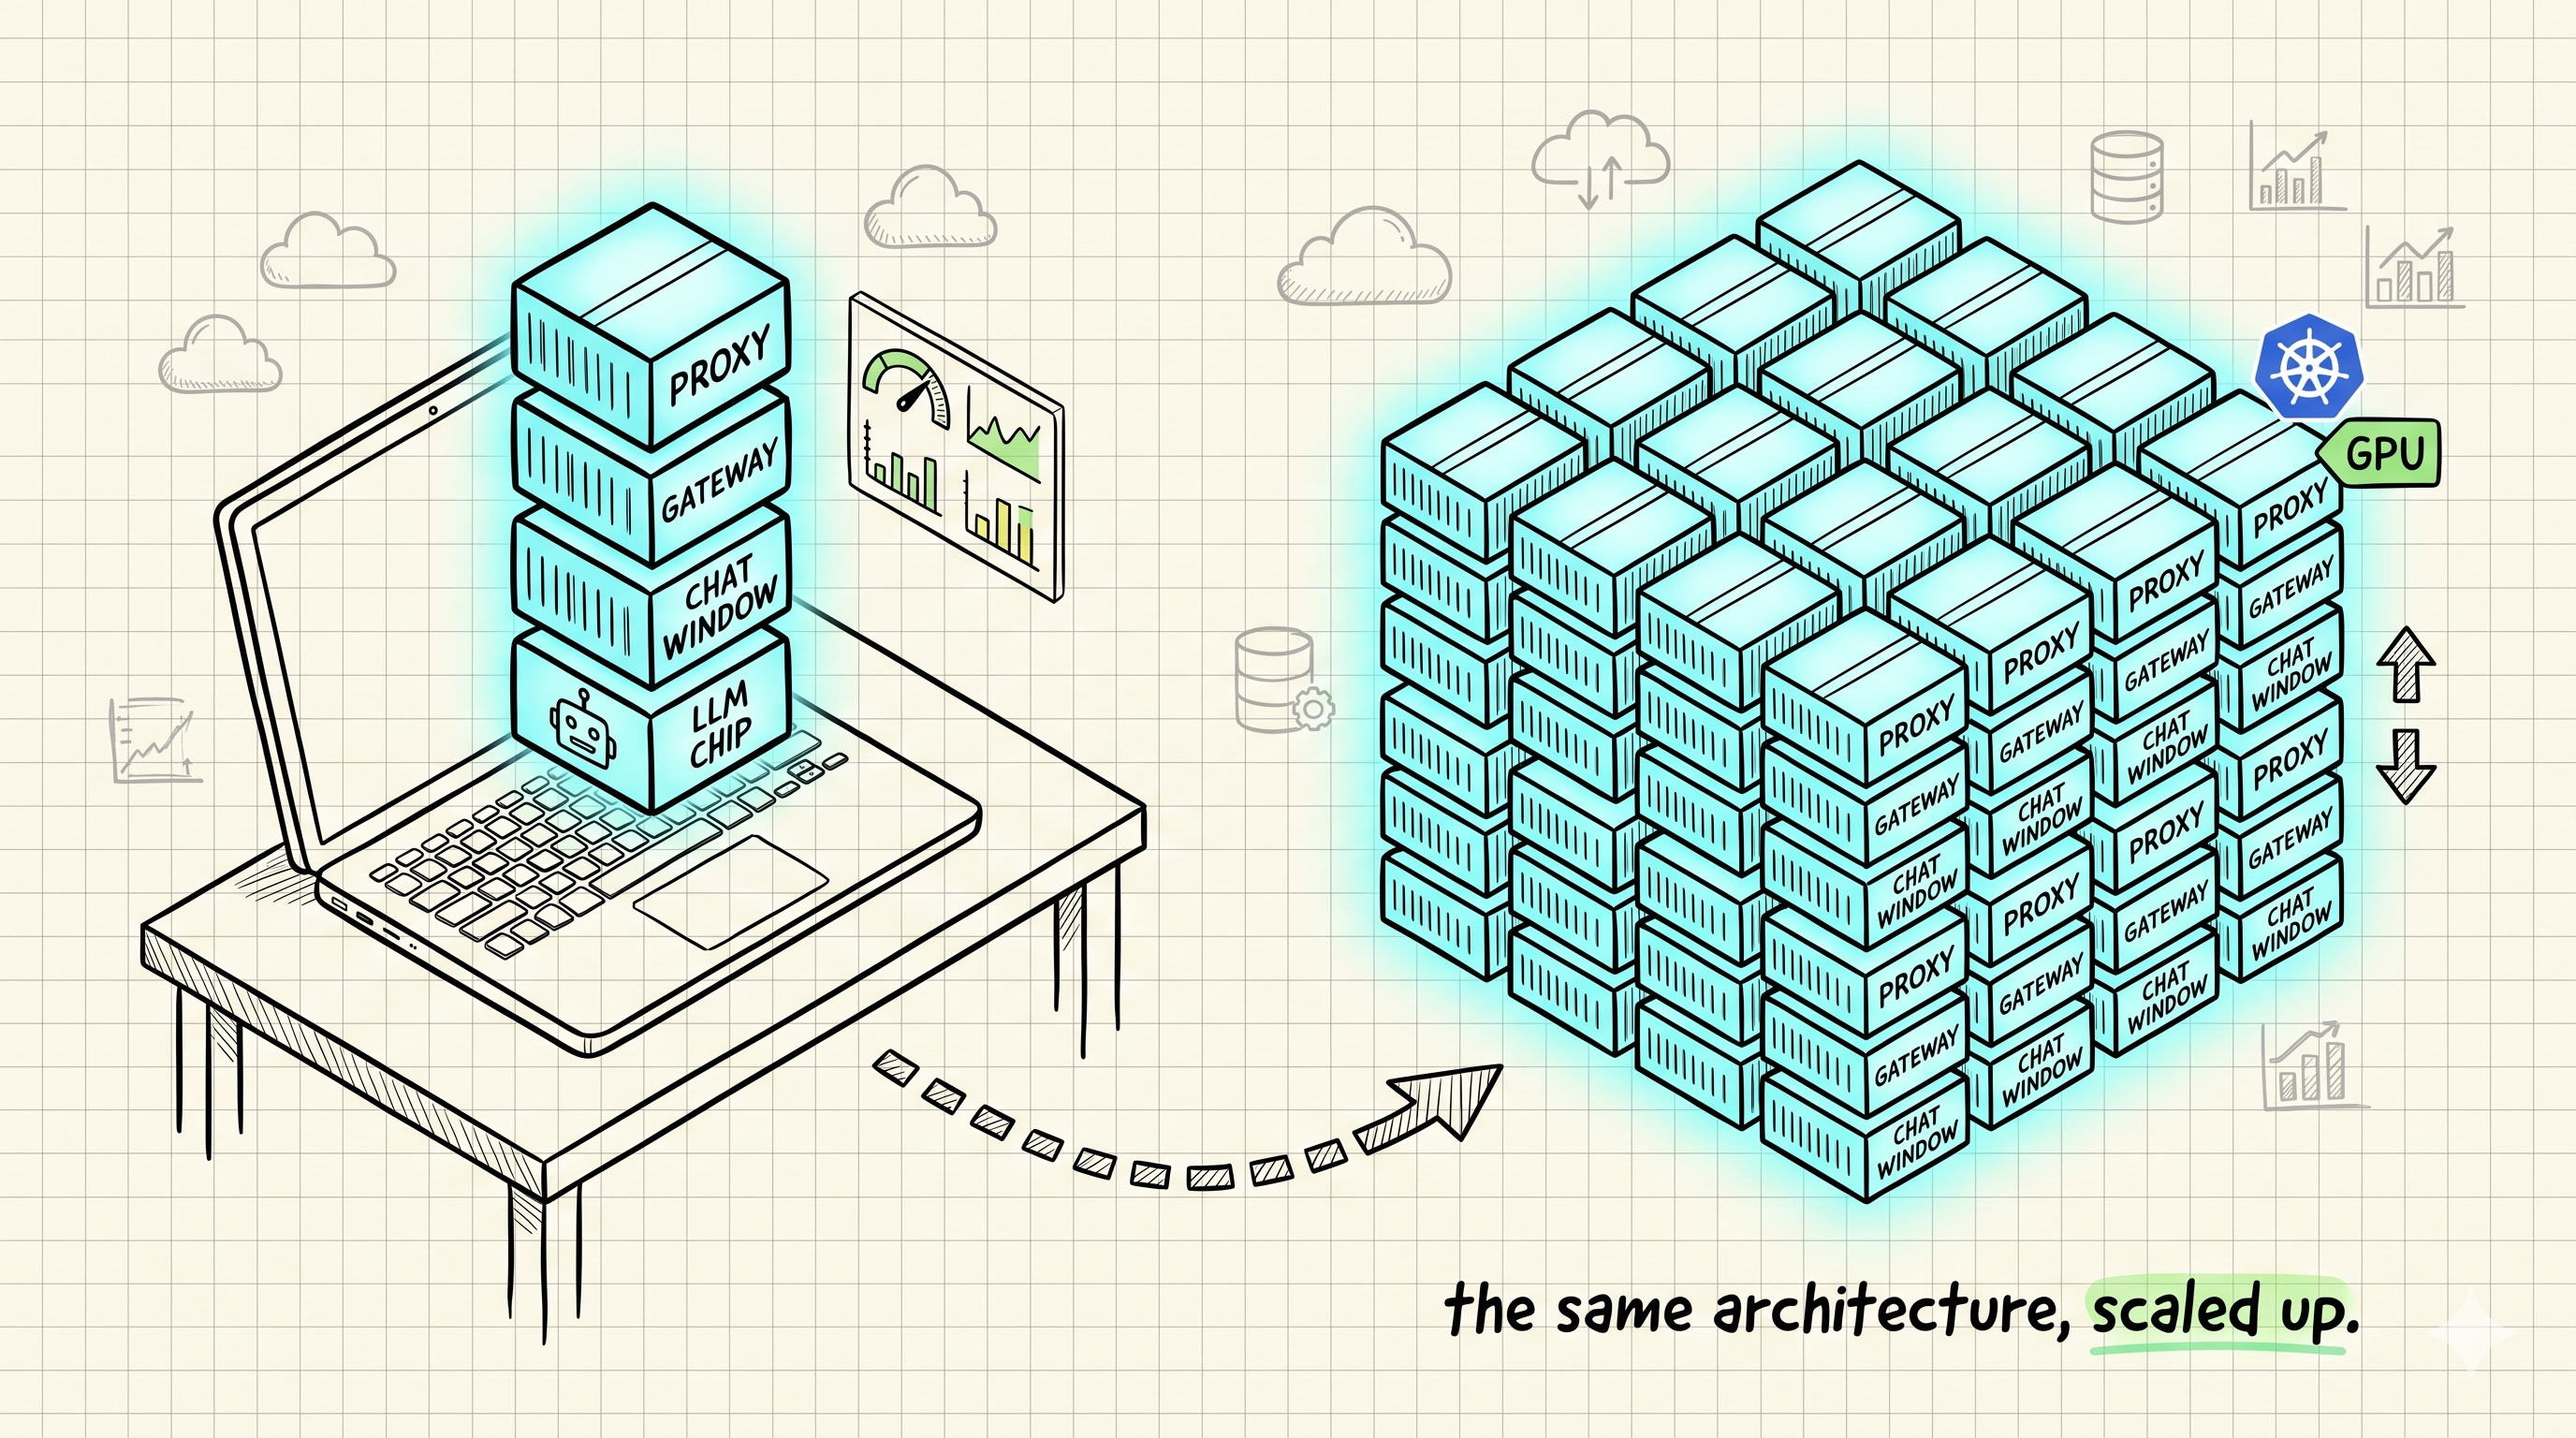
You don't need a GPU cluster to build a real AI platform. Seven containers and one docker compose up give you an OpenAI-compatible gateway, a chat UI, local models, and full observability — on your laptop. And because the API contract never changes, the same architecture maps one-to-one onto production Kubernetes.
The Architecture (and Why It's Shaped This Way)
The naive sketch is a single chain: proxy → gateway → UI → model server. That's not how the traffic actually flows. Here's the corrected shape:
                    ┌──────────────────────────────┐
   Browser ──────►  │  Traefik v3.7 (:80)          │
                    │  chat.localhost / api.localhost / grafana.localhost
                    └──────┬───────────────┬───────┘
                           │               │
                  ┌────────▼──────┐  ┌─────▼────────────┐
                  │ Open WebUI    │  │ LiteLLM v1.88    │◄── Postgres 17
                  │ v0.9.6 (UI)   ├─►│ (gateway)        │    (keys + spend)
                  └───────────────┘  └─────┬────────────┘
                                           │ OpenAI API
                                     ┌─────▼────────────┐
                                     │ Ollama 0.30      │  laptop
                                     │ (vLLM 0.22 prod) │◄── KV cache in GPU VRAM
                                     └──────────────────┘    (prefix caching on)

                  Prometheus v3 ──► scrapes Traefik + LiteLLM ──► Grafana 12
Three deliberate decisions, each a fix to the obvious first draft:
1. Ollama on the laptop, vLLM in production — never the reverse. vLLM 0.22 needs Linux + CUDA and is built for batched throughput on server GPUs. Ollama runs on Apple Silicon (Metal), consumer NVIDIA cards, and even CPU. Because both sit behind LiteLLM, swapping one for the other is a config change, not an architecture change. That's the whole trick: dev/prod parity at the API contract, not at the binary.
2. Everything goes through LiteLLM — including the UI. Open WebUI can talk to Ollama directly, but then your UI traffic bypasses the gateway and you lose metering. Disable Open WebUI's native Ollama connection and point it at LiteLLM's OpenAI endpoint instead. One gateway, one place where every token is counted.
3. Postgres turns the proxy into a platform. Without a database, LiteLLM is just a router. With one, you get virtual API keys, per-key budgets, and spend tracking — the features that make this a platform you can hand to a team, not a demo.
The Stack, Pinned
| Component | Role | Version |
|---|---|---|
| Traefik | Reverse proxy, routing, metrics | v3.7 |
| LiteLLM | OpenAI-compatible gateway, keys, spend | v1.88.1 |
| Open WebUI | Chat frontend | v0.9.6 |
| Ollama | Local model serving (laptop) | 0.30.7 |
| PostgreSQL | LiteLLM state | 17 |
| Prometheus | Metrics | v3.4 |
| Grafana | Dashboards | 12.x |
Hostnames use *.localhost, which resolves to 127.0.0.1 on macOS and Linux without touching /etc/hosts.
The Files
Everything below is in the companion repo — clone it instead of copy-pasting:
ai-platform/
├── docker-compose.yml
├── .env.example            # copy to .env, change the secrets
├── litellm/
│   └── config.yaml
├── prometheus/
│   └── prometheus.yml
├── grafana/
│   ├── provisioning/        # datasource + dashboard auto-provisioning
│   └── dashboards/
│       └── litellm.json     # LiteLLM dashboard, loads on first boot
└── k8s/                     # production reference manifests (vLLM, KEDA, Argo Rollouts)
The repo also auto-provisions the LiteLLM Grafana dashboard (vendored from Grafana.com ID 24965) — no manual import step.
.env
LITELLM_MASTER_KEY=sk-local-master-change-me
POSTGRES_PASSWORD=litellm-local-pw
# macOS: Ollama runs on the host (see the GPU gotcha below)
# OLLAMA_API_BASE=http://host.docker.internal:11434
OLLAMA_API_BASE=http://ollama:11434
docker-compose.yml
name: ai-platform

services:
  traefik:
    image: traefik:v3.7
    command:
      - --providers.docker=true
      - --providers.docker.exposedbydefault=false
      - --entrypoints.web.address=:80
      - --metrics.prometheus=true
      - --api.insecure=true        # dashboard on :8080, local only
    ports:
      - "80:80"
      - "8080:8080"
    volumes:
      - /var/run/docker.sock:/var/run/docker.sock:ro

  open-webui:
    image: ghcr.io/open-webui/open-webui:v0.9.6
    environment:
      # Route ALL traffic through the gateway — no direct Ollama connection
      ENABLE_OLLAMA_API: "false"
      OPENAI_API_BASE_URL: http://litellm:4000/v1
      OPENAI_API_KEY: ${LITELLM_MASTER_KEY}
    volumes:
      - open-webui-data:/app/backend/data
    labels:
      - traefik.enable=true
      - traefik.http.routers.chat.rule=Host(`chat.localhost`)
      - traefik.http.services.chat.loadbalancer.server.port=8080
    depends_on:
      - litellm

  litellm:
    image: ghcr.io/berriai/litellm:v1.88.1
    command: ["--config", "/app/config.yaml"]
    environment:
      LITELLM_MASTER_KEY: ${LITELLM_MASTER_KEY}
      DATABASE_URL: postgresql://litellm:${POSTGRES_PASSWORD}@postgres:5432/litellm
      OLLAMA_API_BASE: ${OLLAMA_API_BASE}
    volumes:
      - ./litellm/config.yaml:/app/config.yaml:ro
    labels:
      - traefik.enable=true
      - traefik.http.routers.api.rule=Host(`api.localhost`)
      - traefik.http.services.api.loadbalancer.server.port=4000
    depends_on:
      postgres:
        condition: service_healthy

  ollama:
    image: ollama/ollama:0.30.7
    profiles: ["linux-gpu"]       # see the GPU gotcha below
    volumes:
      - ollama-models:/root/.ollama
    deploy:
      resources:
        reservations:
          devices:
            - driver: nvidia
              count: all
              capabilities: [gpu]

  postgres:
    image: postgres:17-alpine
    environment:
      POSTGRES_USER: litellm
      POSTGRES_PASSWORD: ${POSTGRES_PASSWORD}
      POSTGRES_DB: litellm
    volumes:
      - postgres-data:/var/lib/postgresql/data
    healthcheck:
      test: ["CMD-SHELL", "pg_isready -U litellm"]
      interval: 5s
      retries: 10

  prometheus:
    image: prom/prometheus:v3.4.1
    volumes:
      - ./prometheus/prometheus.yml:/etc/prometheus/prometheus.yml:ro
      - prometheus-data:/prometheus

  grafana:
    image: grafana/grafana:12.0.1
    environment:
      GF_AUTH_ANONYMOUS_ENABLED: "true"
      GF_AUTH_ANONYMOUS_ORG_ROLE: Admin   # local only — never in prod
    volumes:
      - ./grafana/provisioning:/etc/grafana/provisioning:ro
      - grafana-data:/var/lib/grafana
    labels:
      - traefik.enable=true
      - traefik.http.routers.grafana.rule=Host(`grafana.localhost`)
      - traefik.http.services.grafana.loadbalancer.server.port=3000

volumes:
  open-webui-data:
  ollama-models:
  postgres-data:
  prometheus-data:
  grafana-data:
litellm/config.yaml
model_list:
  - model_name: qwen3-8b
    litellm_params:
      model: ollama_chat/qwen3:8b
      api_base: os.environ/OLLAMA_API_BASE
  - model_name: llama3.1-8b
    litellm_params:
      model: ollama_chat/llama3.1:8b
      api_base: os.environ/OLLAMA_API_BASE

litellm_settings:
  callbacks: ["prometheus"]      # exposes /metrics on :4000

general_settings:
  master_key: os.environ/LITELLM_MASTER_KEY
  database_url: os.environ/DATABASE_URL
The model_name is what clients see; the model is the backend. In production you change two lines per model — ollama_chat/qwen3:8b becomes hosted_vllm/Qwen/Qwen3-8B and the api_base points at your vLLM service. No client notices.
prometheus/prometheus.yml
global:
  scrape_interval: 15s

scrape_configs:
  - job_name: traefik
    static_configs:
      - targets: ["traefik:8080"]
  - job_name: litellm
    static_configs:
      - targets: ["litellm:4000"]
  - job_name: prometheus
    static_configs:
      - targets: ["localhost:9090"]
grafana/provisioning/datasources/prometheus.yml
apiVersion: 1
datasources:
  - name: Prometheus
    type: prometheus
    url: http://prometheus:9090
    isDefault: true
The GPU Gotcha on macOS
Docker on macOS cannot see the Apple GPU. Run Ollama inside a container on a Mac and every token is generated on CPU — a 8B model drops from ~40 tok/s to single digits.
The fix: run Ollama natively on the host and point the stack at it.
# macOS — Ollama on the host, everything else in Docker
brew install ollama
ollama serve &
ollama pull qwen3:8b

# in .env:
# OLLAMA_API_BASE=http://host.docker.internal:11434
On a Linux laptop with an NVIDIA card, the containerized path works at full speed — enable the profile:
Launch and Verify
Smoke-test the gateway directly — this is the same call your apps will make:
curl http://api.localhost/v1/chat/completions \
  -H "Authorization: Bearer sk-local-master-change-me" \
  -H "Content-Type: application/json" \
  -d '{"model": "qwen3-8b", "messages": [{"role": "user", "content": "Reply with exactly: platform up"}]}'
Then mint a scoped key with a budget — the platform move:
curl http://api.localhost/key/generate \
  -H "Authorization: Bearer sk-local-master-change-me" \
  -H "Content-Type: application/json" \
  -d '{"key_alias": "team-a", "max_budget": 5.00, "models": ["qwen3-8b"]}'
Checklist:
-
http://chat.localhost— Open WebUI loads,qwen3-8bappears in the model picker -
http://api.localhost/health/livelinessreturns alive -
http://api.localhost/metricsshowslitellm_*metrics -
http://grafana.localhost— the LiteLLM dashboard appears under AI Platform (auto-provisioned by the repo) -
http://localhost:8080— Traefik dashboard shows 3 routers - A virtual key with
max_budgetset actually gets blocked after the budget is spent
Production: Same Boxes, Kubernetes Underneath
The compose file is the architecture diagram. Production replaces each box's runtime, not its role:
| Laptop | Production (Kubernetes 1.33+) | Why |
|---|---|---|
| Traefik container | Ingress via Gateway API + cert-manager | TLS, real DNS |
| Ollama | vLLM 0.22 on GPU nodes | Continuous batching, 10–20× throughput |
| LiteLLM container | LiteLLM Helm chart, 2+ replicas + Redis | HA gateway, shared rate-limit state |
| Postgres container | CloudNativePG or managed (RDS) | Backups, failover |
| Prometheus + Grafana | kube-prometheus-stack | ServiceMonitors, alerting |
docker compose up | Argo CD (GitOps) | Auditable, repeatable deploys |
Three infrastructure additions are non-negotiable once GPUs and real traffic enter the picture — plus one concept, the KV cache, that quietly sets the ceiling on all of them.
NVIDIA GPU Operator — make GPUs schedulable
Bare Kubernetes doesn't know what a GPU is. The GPU Operator installs the driver, container toolkit, device plugin, and DCGM exporter (GPU metrics into the same Prometheus) as a Helm release:
helm install gpu-operator nvidia/gpu-operator \
  -n gpu-operator --create-namespace \
  --set dcgmExporter.serviceMonitor.enabled=true
After that, vLLM pods just request nvidia.com/gpu: 1. On shared clusters, add MIG or time-slicing to split large GPUs across small models.
KV cache — the memory that sets your real throughput
Every token a model generates writes a key/value tensor in each layer, and every later token attends back to all of them. That stored history is the KV cache — and it, not the model weights, is what actually fills your GPU and caps how many requests run at once.
Do the math once; it reframes everything. Llama 3.1 8B in FP16:
| Consumer | Size |
|---|---|
| Model weights | ~16 GB (fixed) |
| KV cache | ~128 KB per token |
On an 80GB H100, weights leave ~60GB for KV cache — about 500K tokens of headroom. At an 8K context window that's only ~60 concurrent full-length requests before vLLM starts queuing. And that queue is exactly what vllm:num_requests_waiting (the KEDA signal below) measures. KV cache pressure is why you scale at all.
Where it lives, and what to set
The KV cache lives in GPU VRAM by default, and you don't size it directly. vLLM grabs a fixed slice of the card (--gpu-memory-utilization, default 0.9), loads the weights into it, and whatever's left becomes the KV cache pool — managed in blocks by PagedAttention. So with zero flags it already works; the slice fills itself. The knobs only matter when you're tuning capacity against context length:
vllm serve Qwen/Qwen3-8B \
  --gpu-memory-utilization 0.92 \   # bigger slice = more KV cache room (dedicated GPU)
  --max-model-len 8192 \            # cap context → less KV/request → more concurrency
  --kv-cache-dtype fp8              # quantize KV cache, ~2× capacity for a small quality hit
  # prefix caching is ON by default in the V1 engine — no flag needed
| Flag | Default | Effect on the KV cache |
|---|---|---|
--gpu-memory-utilization | 0.9 | Fraction of VRAM vLLM claims. Higher → larger cache pool. |
--max-model-len | model max | Biggest lever. Lower context → each request reserves less cache → more fit at once. |
--kv-cache-dtype | auto (FP16) | fp8 roughly doubles token capacity. |
--max-num-seqs | 256 | Hard cap on concurrent sequences per batch. |
--no-enable-prefix-caching | (off) | Pass it to disable prefix caching — you almost never want to. |
Three levers stretch that budget, in increasing order of effort:
1. Prefix caching — free, and already on. vLLM's V1 engine caches the KV of every prefix and reuses it when a new request shares one, so identical system prompts, few-shot blocks, and RAG context get computed once instead of per request. It's zero-overhead and enabled by default — just don't pass --no-enable-prefix-caching. For an agent or RAG workload with a fat shared system prompt, this alone can halve prefill compute.
2. KV cache offloading — when VRAM is the wall. LMCache moves cold KV blocks out of GPU memory into a tiered hierarchy (CPU RAM → local NVMe → remote store), so a block that would've been evicted survives to be reused later. The vLLM production-stack wires it in via Helm. You trade a little latency for a much higher hit rate — worth it when prompts are long and reused across time, not just within one batch.
3. KV-cache-aware routing — when you have many replicas. Round-robin across vLLM pods throws away cache hits: pod B recomputes a prefix pod A already holds. llm-d (CNCF Sandbox since March 2026) ships an inference scheduler that tracks which pod holds which prefix and routes to maximize hits, using the Gateway API Inference Extension. It sits in front of vLLM — conceptually where LiteLLM sits on your laptop — so it's the natural production upgrade to gateway routing once one replica isn't enough.
On the laptop, Ollama already caches the most recent context, so a follow-up turn in the same chat is fast. But it has nothing like cross-user prefix caching or cache-aware routing — those only matter, and only exist, under multi-replica concurrency. The laptop teaches you the contract; the KV cache is the first thing that contract lets you optimize hard.
KEDA — scale vLLM on queue depth, not CPU
CPU utilization is meaningless for GPU inference. The signal that matters is how many requests are waiting, and vLLM exports it as vllm:num_requests_waiting:
apiVersion: keda.sh/v1alpha1
kind: ScaledObject
metadata:
  name: vllm-qwen3
spec:
  scaleTargetRef:
    name: vllm-qwen3
  minReplicaCount: 1          # never 0 — model load takes minutes
  maxReplicaCount: 8
  cooldownPeriod: 600         # GPUs are expensive to thrash
  triggers:
    - type: prometheus
      metadata:
        serverAddress: http://prometheus.monitoring:9090
        query: sum(vllm:num_requests_waiting{model_name="Qwen/Qwen3-8B"})
        threshold: "10"
Two caveats from the field. First, a new vLLM replica isn't ready when the pod starts — pulling a multi-GB image plus loading weights takes 5–10 minutes, so pair KEDA with Karpenter and set thresholds to scale early. Second, resist scale-to-zero for anything user-facing; the cold start is brutal.
Argo Rollouts — canary the cheap tier, route-shift the expensive one
Argo Rollouts gives you progressive delivery with automatic rollback on metric regression. Use it freely on the stateless tier — LiteLLM and Open WebUI cost nothing to run at 2× during a canary:
strategy:
  canary:
    steps:
      - setWeight: 10
      - pause: {duration: 5m}   # watch litellm error rate in Prometheus
      - setWeight: 50
      - pause: {duration: 5m}
For vLLM, think twice: a pod-level canary of a model server doubles your GPU bill during the rollout. The cheaper pattern for model upgrades is to deploy the new model as a separate deployment and shift traffic in LiteLLM's router config (weighted model_list entries) — canary at the gateway, not the pod.
Production readiness checklist
- GPU Operator installed, DCGM metrics visible in Grafana
- GPU memory budgeted from KV-cache math, not just weights — know your concurrent-request ceiling
- vLLM prefix caching left on (the V1 default); shared system prompts and RAG context computed once
- vLLM behind LiteLLM; clients still call the same
model_nameas on the laptop - KEDA ScaledObject on
vllm:num_requests_waiting,minReplicaCount: 1 - At scale: LMCache offloading for long reused prompts, or llm-d for KV-cache-aware routing across replicas
- LiteLLM ≥2 replicas with Redis; master key in a Secret, not a ConfigMap
- Argo Rollouts canary on LiteLLM/Open WebUI with a Prometheus
AnalysisTemplate - TLS via cert-manager; Grafana anonymous auth off
- Budget alerts on LiteLLM spend metrics before someone's agent loop burns the quota
Summary
| Rule | On the laptop | In production |
|---|---|---|
| One gateway meters everything | LiteLLM, UI included | Same, 2+ replicas + Redis |
| Match the model server to the hardware | Ollama (Metal/consumer GPU) | vLLM 0.22 (CUDA, batching) |
| Stretch each GPU before adding more | Ollama context cache | KV cache: prefix caching (default), LMCache offload, llm-d cache-aware routing |
| Scale on the right signal | n/a | KEDA on vllm:num_requests_waiting |
| Ship progressively | n/a | Argo Rollouts (stateless tier), router weights (models) |
| Observe from day one | Prometheus + Grafana in compose | kube-prometheus-stack + DCGM |
The portable asset isn't the compose file — it's the contract. Every client talks OpenAI-flavored HTTP to one gateway hostname, and everything behind it is swappable. That's what makes the laptop version a real rehearsal for production instead of a toy.
All code, configs, and the production reference manifests: github.com/pkhamdee/ai-platform.
Discussion
Have thoughts on this post? Share them below — questions, corrections, or your own experience are all welcome.